
Q1 2026 Housing Construction Report: Activity Holds While Future Momentum Softens
 National Overview
Canada’s housing-start figures remained positive through the first quarter of 2026, but the underlying construction cycle continued to lose momentum beneath the headline totals.
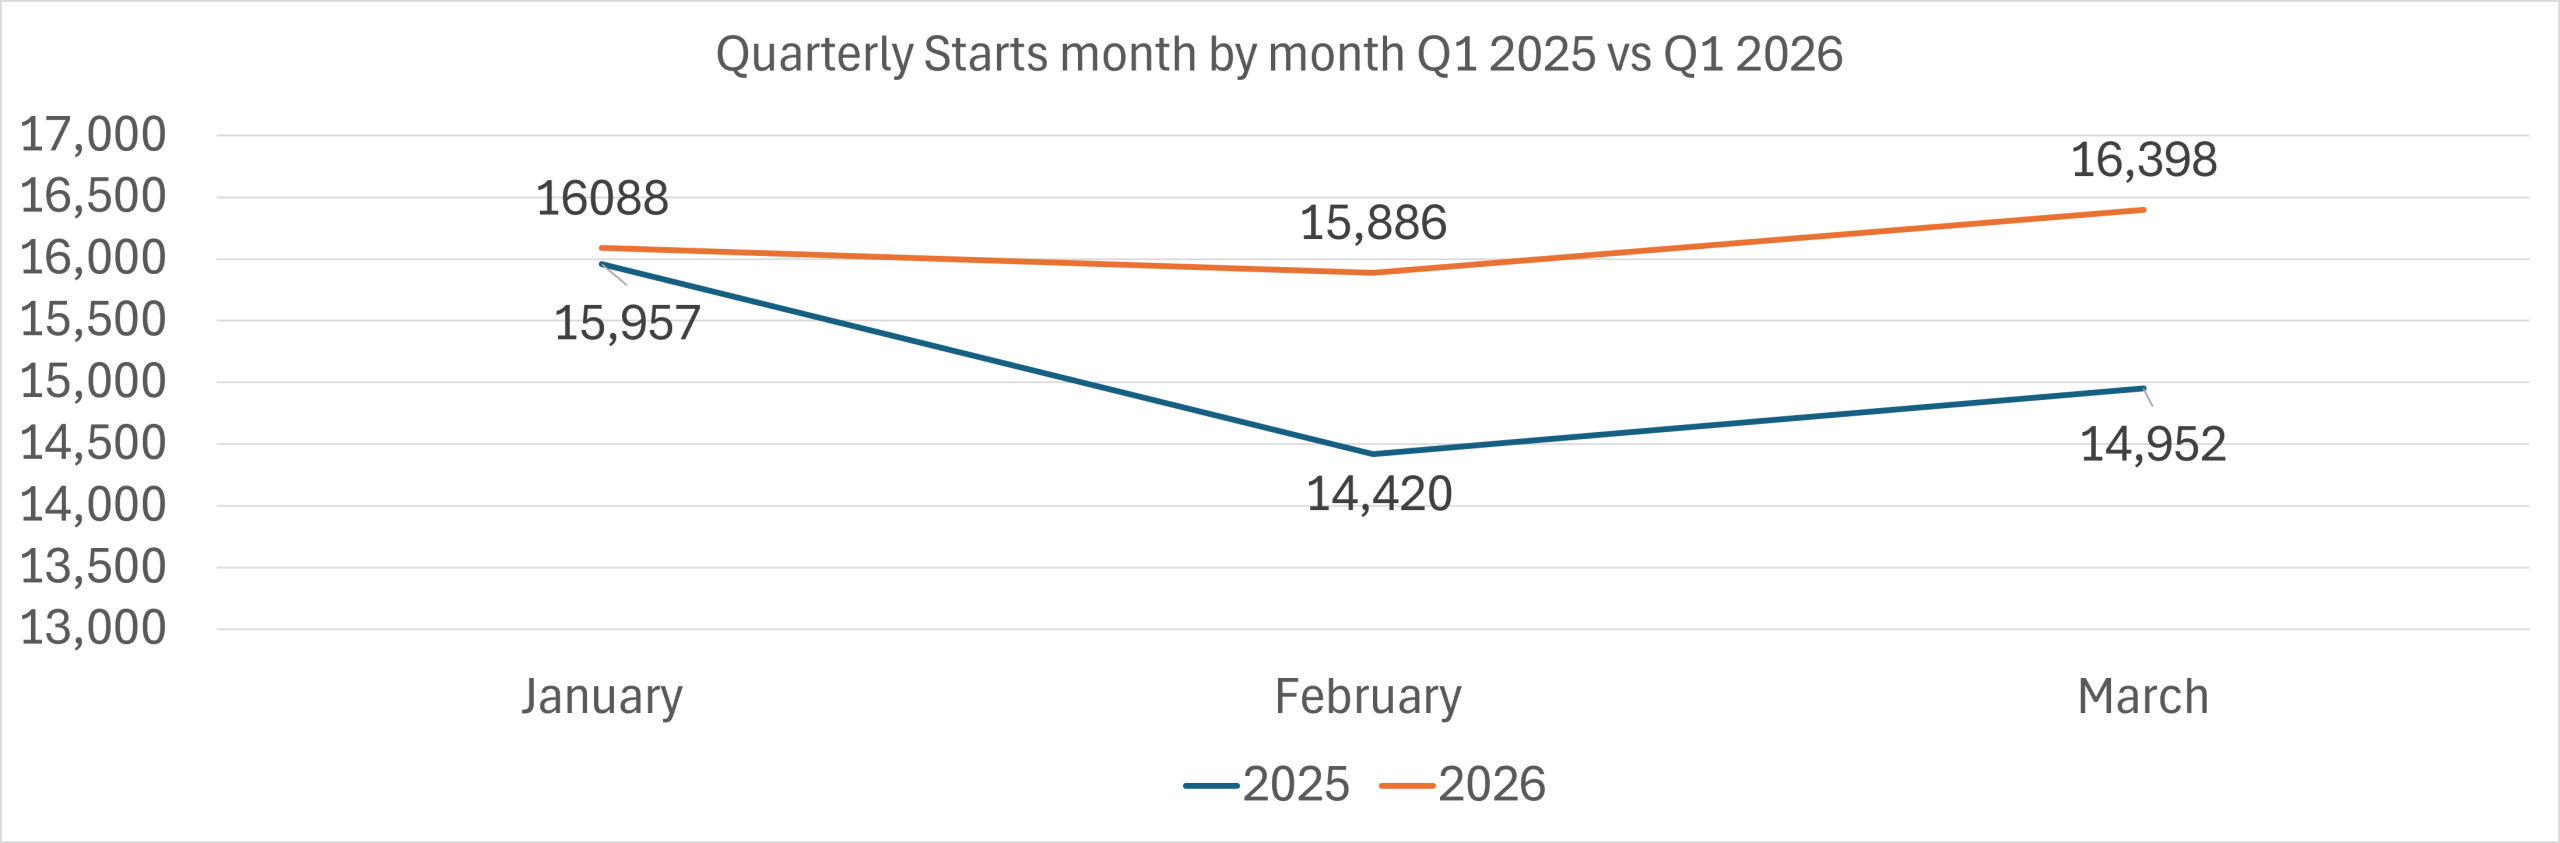
Actual housing starts in centres with populations above 10,000 increased from 45,329 units in Q1 2025 to 48,372 units in Q1 2026, a gain of roughly 6.7%. January was effectively flat year over year before activity strengthened in February and March.
January: 15,957 → 16,088 (+1%)
February: 14,420 → 15,886 (+10%)
March: 14,952 → 16,398 (+10%)
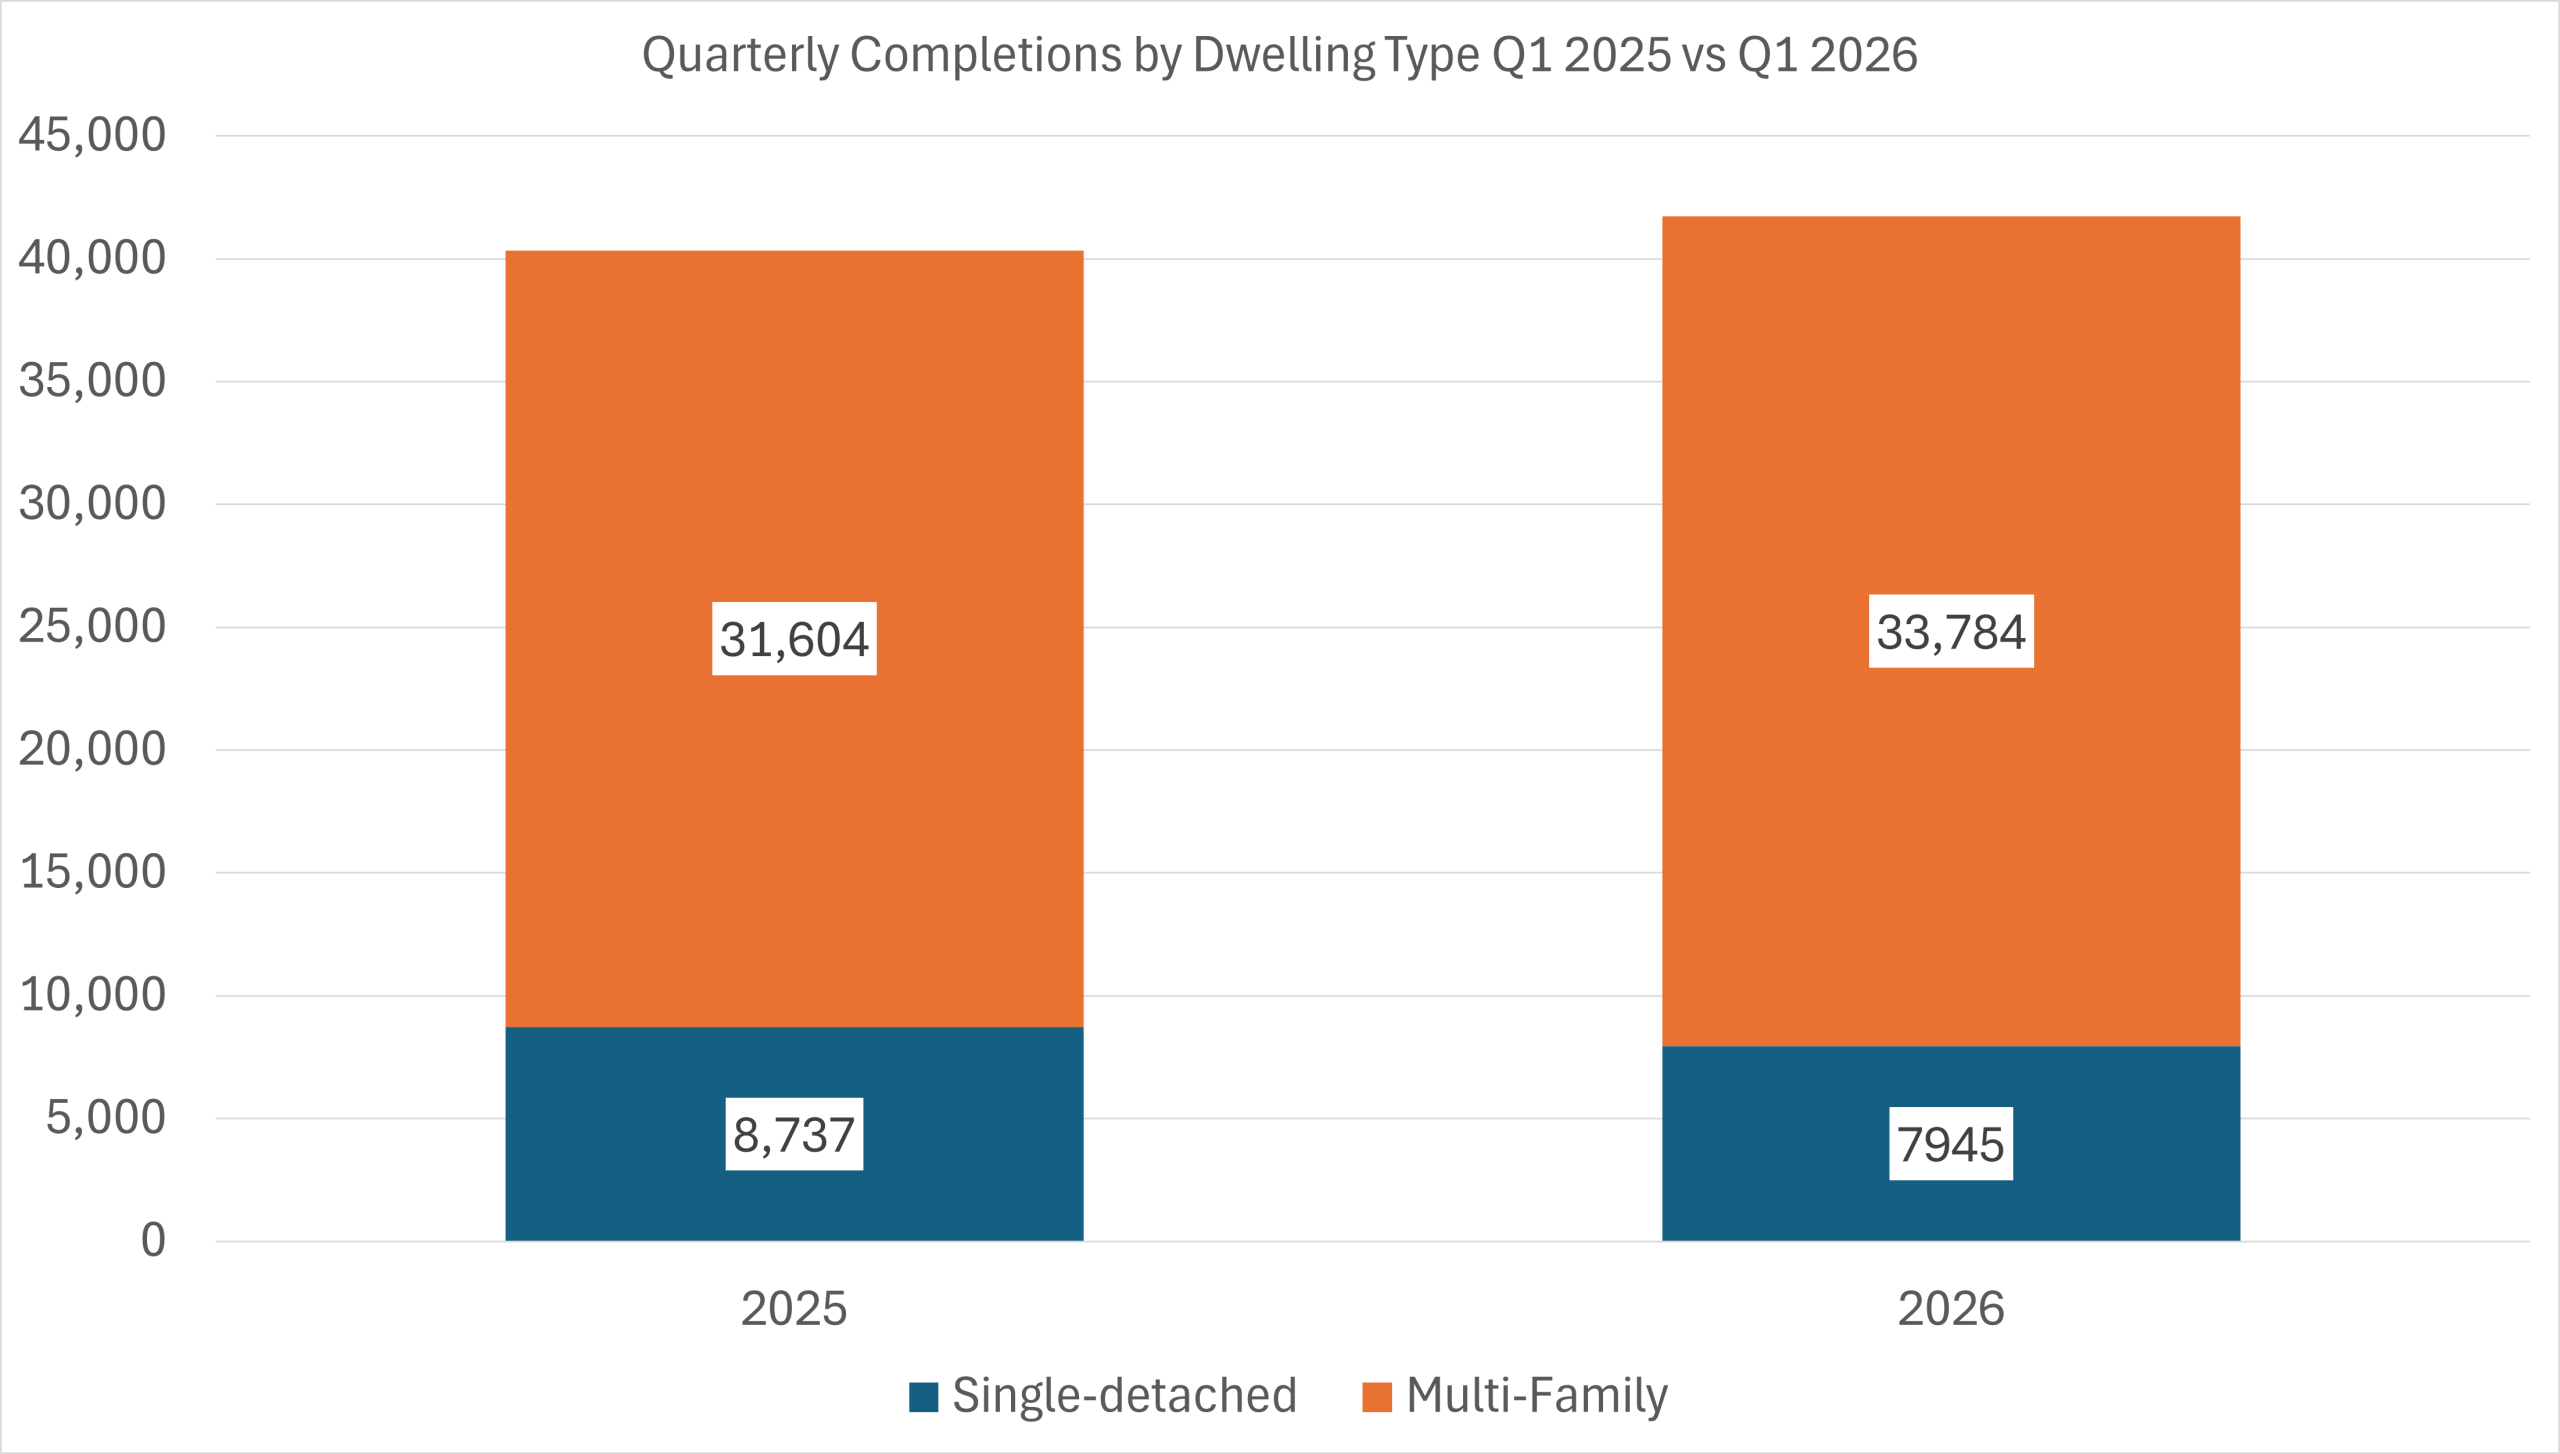
The quarter’s gains were concentrated primarily in multi-family construction.
Single-detached starts decreased from 8,527 units in Q1 2025 to 7955 in Q1 2026, a loss of roughly 7%.
Multi-family starts increased from 38,782 units to 43,256, up nearly 11%.
That product mix continues reshaping how national housing data should be interpreted.
Canadian residential construction is now increasingly dominated by apartment and large-scale multi-unit projects rather than detached housing. That transition matters because apartment construction behaves differently operationally and financially. Projects move through longer approval cycles, require more extensive financing arrangements, and often depend on preleasing or presale thresholds before construction can begin.
The result is that housing starts increasingly reflect decisions made many months earlier rather than current market sentiment.
 That lag is visible throughout the first-quarter data.
Construction activity remained elevated because projects financed and approved during stronger market conditions continue moving into active development. At the same time, CMHC and industry participants have increasingly pointed toward weakening forward conditions driven by softer condominium presales, rising inventories, elevated borrowing costs, and more cautious lender underwriting.
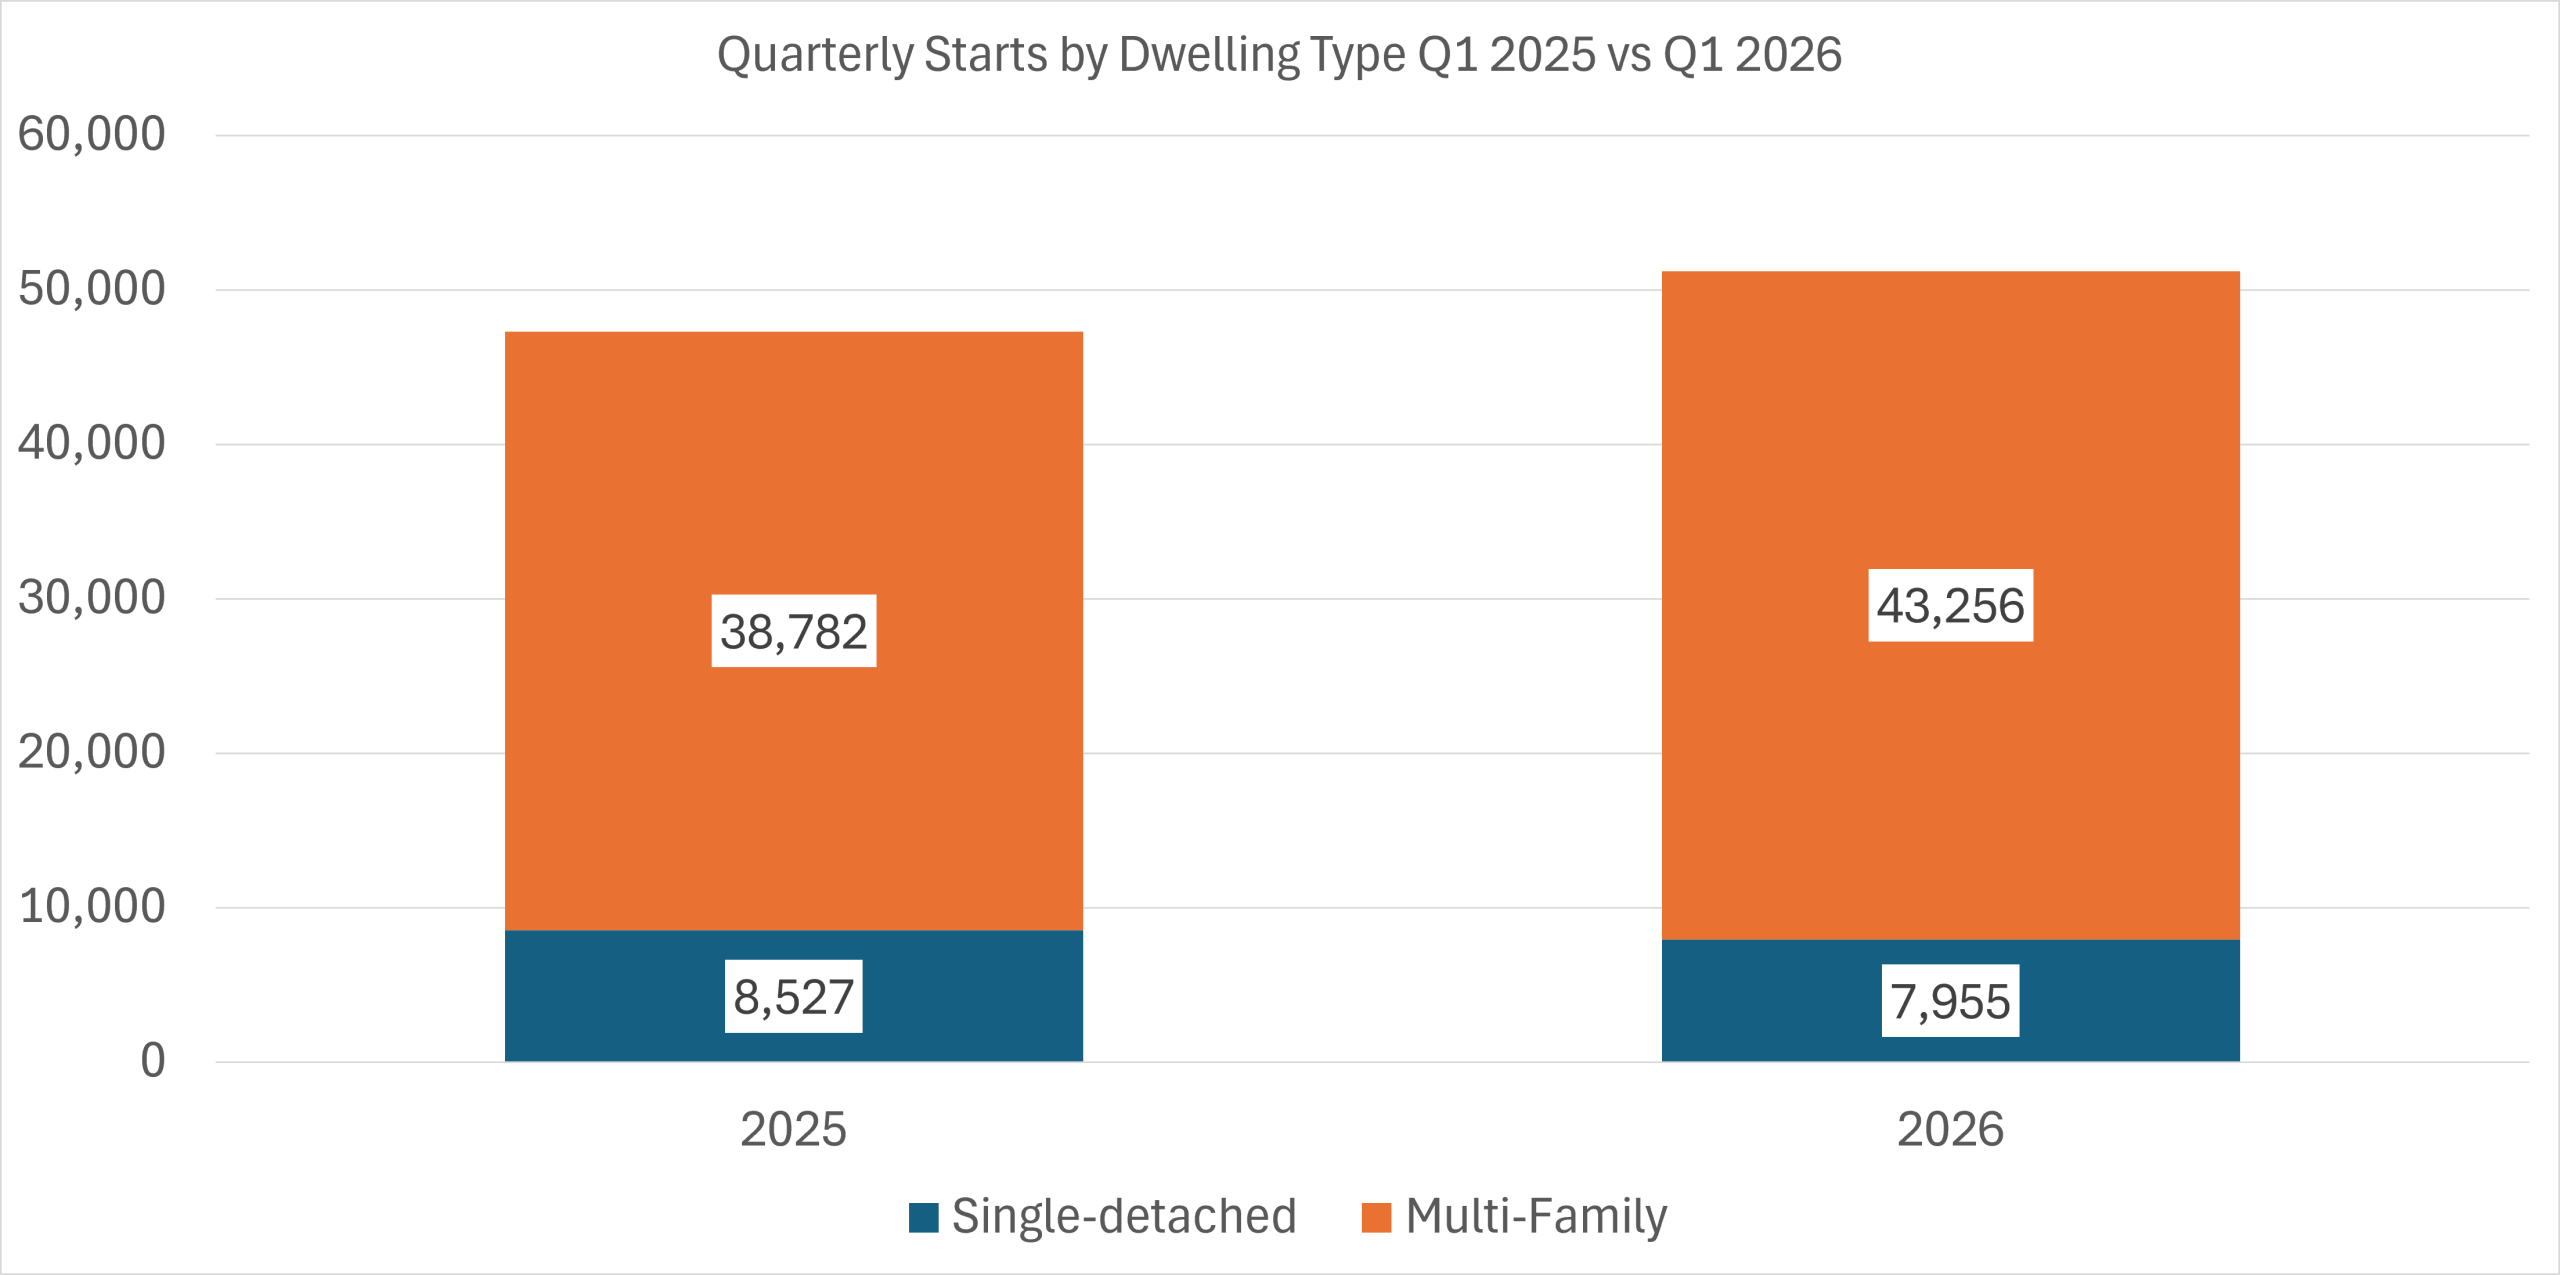 Completion data reinforces the distinction between current activity and future momentum.
In population centres above 100,000, single-detached completions declined from 8,737 units in Q1 2025 to 7,945 in Q1 2026, a drop of just over 9%.
Multi-family completions increased from 31,604 units to 33,784, up nearly 7%.
Those units largely represent projects conceived and financed under materially different market conditions than exist today.
The industry is therefore operating through two overlapping phases simultaneously: a high-volume completion cycle tied to earlier financing conditions and a weaker future pipeline shaped by today’s tighter economics.
That distinction matters operationally. Developers may continue advancing projects already under construction even while delaying new launches or revising future development plans.
The first quarter therefore reflected a market that remains visibly active while becoming more selective beneath the surface.
 Provincial Breakdown
British Columbia
British Columbia recorded a modest decline in starts during the quarter.
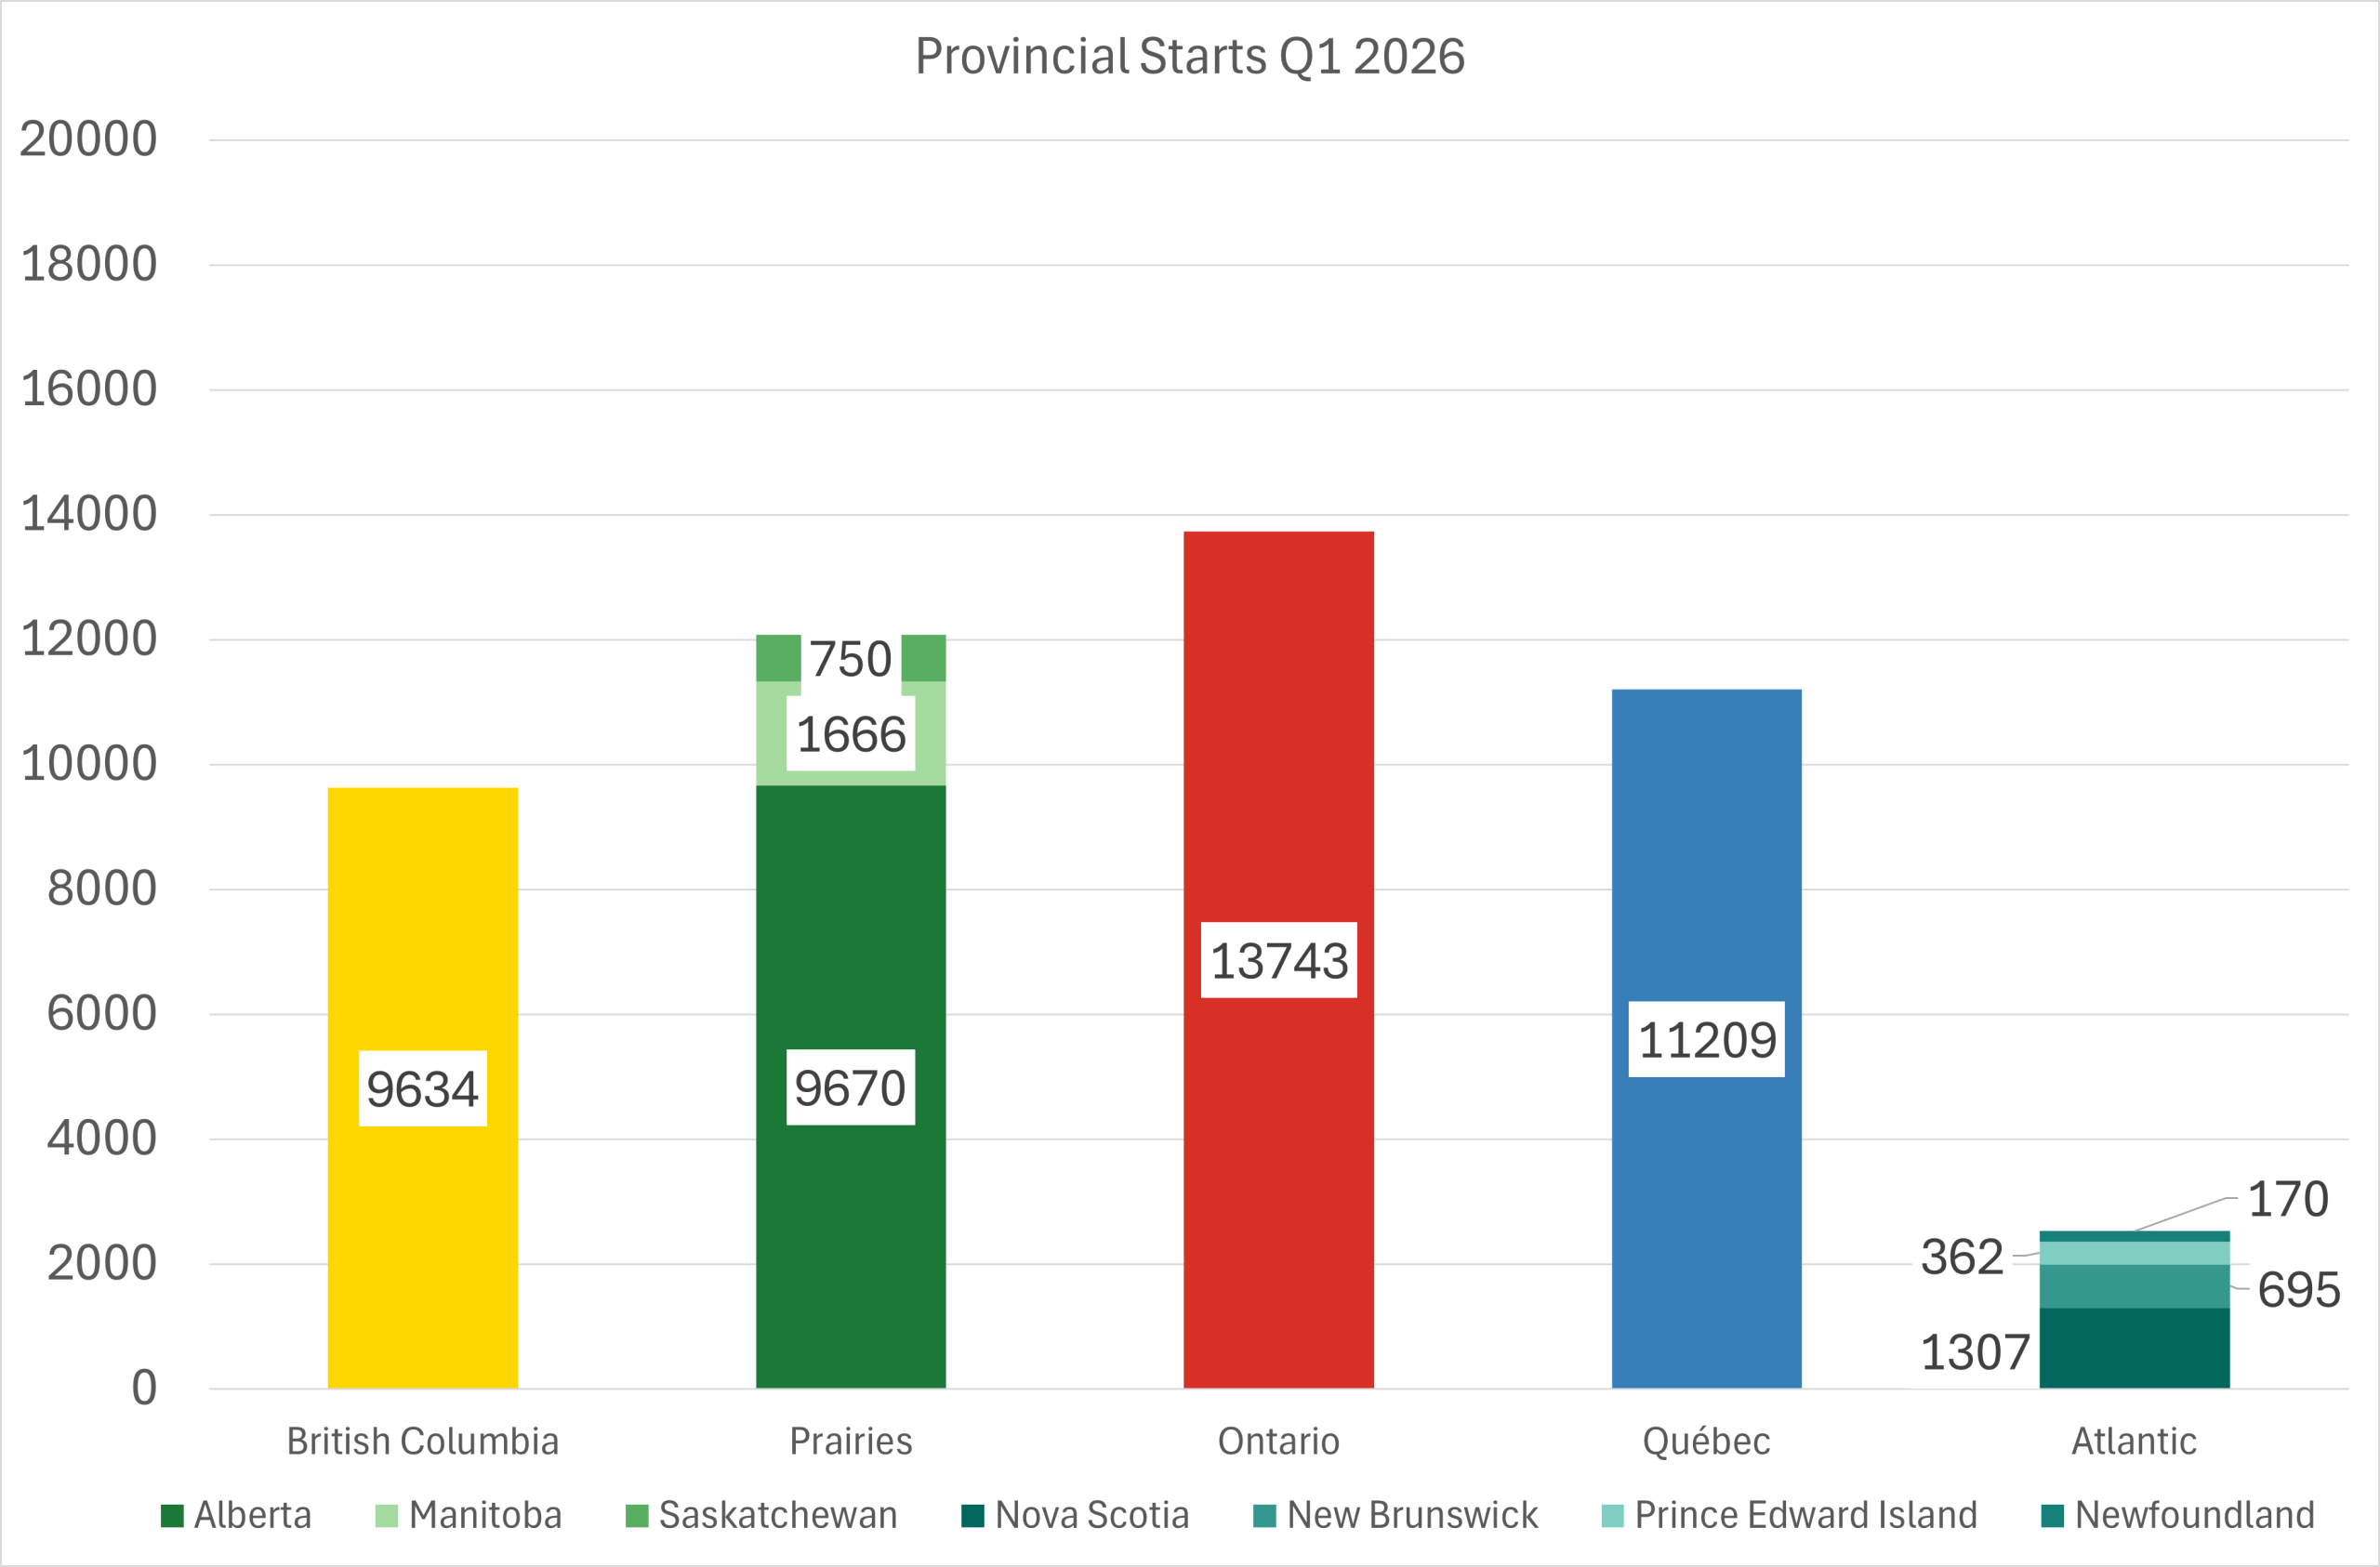
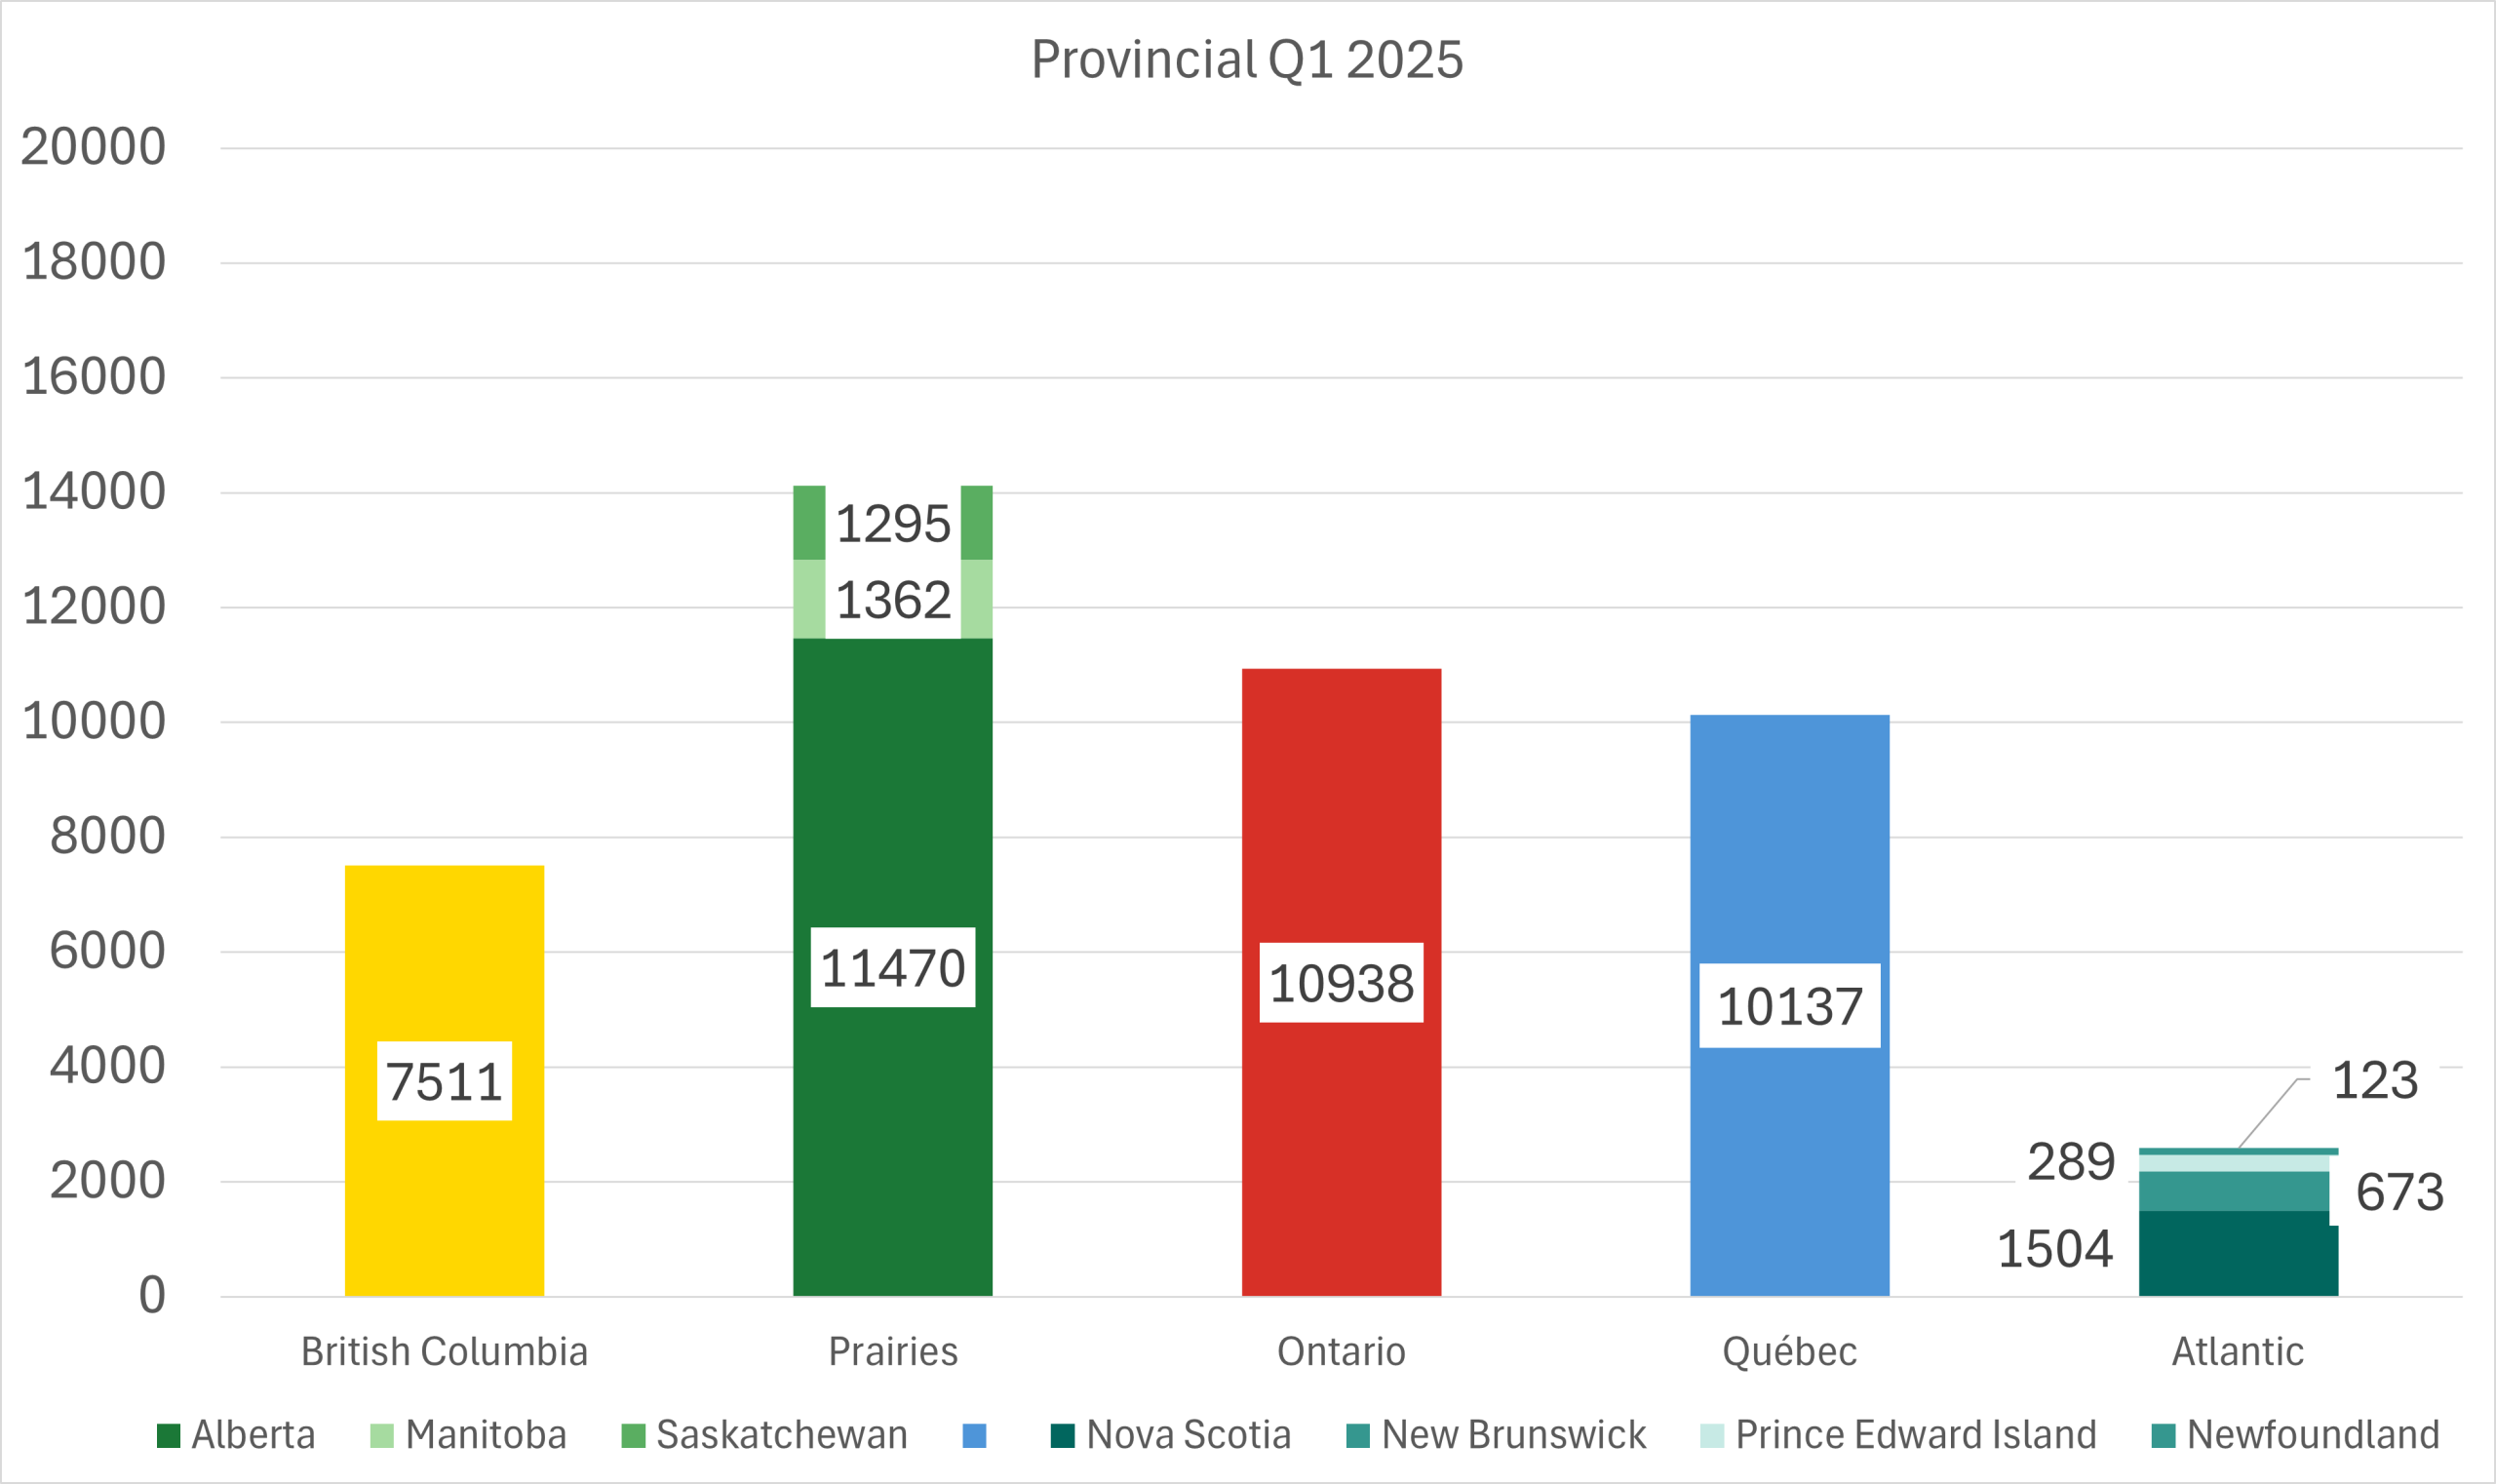
British Columbia: 9,965 → 9,634 (-3%)
The provincial slowdown contrasted somewhat with stronger activity within Metro Vancouver during parts of the quarter.
Vancouver: 4834 → 6706 (+39%)
Abbotsford: 682 → 70 (-90%)
Chilliwack: 143 → 52 (-64%)
Kamloops: 135 → 472 (+250%)
Kelowna: 541 → 559 (+3%)
Nanaimo: 107 → 84 (-21%)
Victoria: 612 → 692 (+13%)
The divergence between Vancouver and several secondary British Columbia markets reflects the uneven nature of the province’s current construction cycle.
A relatively small number of high-density projects entering construction in Metro Vancouver can materially affect provincial totals, particularly in quarters where activity slows elsewhere.
Vancouver’s construction pipeline continues to rely heavily on apartments and purpose-built rental projects. But the region also remains exposed to many of the pressures now affecting high-density development nationally: weak condominium presales, elevated construction costs, expensive land, and increasingly cautious financing conditions.
CMHC’s recent analysis noted signs of stabilization in both permits and starts in Vancouver rather than outright expansion. Construction activity remains substantial because projects already in the pipeline continue advancing, but the pace of new viable project formation appears slower than earlier in the cycle.
Outside the Lower Mainland, activity across British Columbia has become increasingly uneven. Kamloops posted a sharp increase from a relatively small base while several Fraser Valley markets moved materially lower.
The province’s first-quarter totals ultimately reflected both the scale and volatility of apartment-driven construction activity.
Alberta and the Prairies
Alberta posted one of the more notable reversals in the country after several years of unusually strong housing activity.
Alberta: 11,470 → 9,670 (-16%)
The province had previously benefited from rapid population growth, interprovincial migration, and comparatively affordable housing relative to Toronto and Vancouver.
That earlier momentum drove a substantial expansion in both detached and multi-family construction across Calgary and Edmonton. By early 2026, however, rising inventories and the large volume of units already under construction appear to be moderating the pace of new starts.
Calgary: 6271 → 5005 (-20%)
Edmonton: 4095 → 3401 (-17%)
Lethbridge: 184 → 244 (+33%)
Red Deer: 46 → 162 (+252%)
The decline in Calgary and Edmonton suggests the province is transitioning away from the accelerated growth phase seen over the past several years.
CMHC’s broader commentary has noted that Prairie markets generally contain a larger share of low-rise and detached housing relative to Toronto or Montréal, where high-rise apartments dominate. That shorter construction cycle can cause Prairie markets to respond more quickly to changes in financing conditions and buyer demand.
Saskatchewan also recorded one of the sharpest declines nationally.
Saskatchewan: 1,295 → 750 (-42%)
Regina: 511 → 172 (-66%)
Saskatoon: 707 → 575 (-19%)
While smaller in absolute terms, the decline reinforces the broader softening trend across parts of the Prairie region.
Manitoba moved in the opposite direction.
Manitoba: 1,362 → 1,666 (+22%)
Winnipeg: 1189 → 1410 (+19%)
The increase suggests more stable project flow in Winnipeg relative to the sharper slowdown occurring elsewhere in the Prairies.
Ontario
Ontario accounted for much of the national increase in starts during the quarter.
Ontario: 10,938 → 13,743 (+26%)
The province’s gains were large enough to offset substantial declines elsewhere in the country.
Toronto’s activity fluctuated throughout the quarter but strengthened meaningfully in March.
Toronto: 5072 → 4889 (-4%)
Barrie: 80 → 70 (-13%)
Belleville: 186 → 16 (-91%)
Brantford: 360 → 401 (+11%)
Guelph: 5 → 40 (+700%)
Hamilton: 487 → 698 (+43%)
Kingston: 212 → 53 (-75%)
Kitchener-Cambridge-Waterloo: 859 → 1288 (+50%)
London: 296 → 998 (+237%)
Oshawa: 88 → 109 (+24%)
Ottawa-Gatineau: 2609 → 2989 (+15%)
Peterborough: 20 → 24 (+20%)
St. Catharines-Niagara: 411 → 800 (+95%)
Thunder Bay: 23 → 101 (+339%)
Windsor: 123 → 56 (-54%)
The provincial figures show just how uneven Ontario’s market has become.
Large multi-tower apartment and condominium projects continue dominating the Greater Toronto Area pipeline, and the timing of a relatively small number of projects entering construction can materially alter quarterly totals.
At the same time, Toronto remains one of the markets facing the greatest pressure on future project viability.
Weak condominium absorption, rising unsold inventory, elevated borrowing costs, and high construction pricing continue affecting the economics of new development. Several industry participants have already slowed launches or revised project timelines while reassessing financing assumptions and achievable pricing.
Elsewhere in Ontario, several mid-sized markets posted substantial percentage gains from smaller bases, including London, St. Catharines-Niagara, and Kitchener-Cambridge-Waterloo. Ottawa-Gatineau also continued showing comparatively stable activity.
The province’s stronger first-quarter starts numbers therefore do not necessarily indicate improving market sentiment.
Instead, the data more likely reflects projects already financed and approved moving into active construction despite softer current conditions.
That distinction increasingly defines Ontario’s housing market. Construction sites remain active, but the future pipeline appears thinner than current activity alone would suggest.
Québec
Québec posted moderate first-quarter growth supported largely by multi-family activity.
Québec: 10,137 → 11,209 (+11%)
Montréal contributed significantly to that increase.
Montréal: 5327 → 4870 (-9%)
Drummondville: 243 → 225 (-7%)
Québec City: 1477 → 1740 (+18%)
Saguenay: 167 → 368 (+120%)
Sherbrooke: 255 → 716 (+181%)
Saint-Jean-sur-Richelieu: 49 → 59 (+20%)
Trois-Rivières: 189 → 247 (+31%)
As in Toronto and Vancouver, Montréal’s construction cycle is increasingly shaped by apartment development rather than detached housing.
The city continues seeing substantial multi-unit activity, particularly in rental-oriented construction. But Québec developers also face many of the same pressures affecting major urban markets nationally: rising labour costs, financing constraints, and more cautious investor assumptions.
Several secondary Québec markets posted strong percentage increases during the quarter, particularly Sherbrooke and Saguenay, though both grew from comparatively smaller bases.
CMHC’s recent analysis suggested that permit activity in Montréal has begun stabilizing even while starts remain relatively elevated.
That divergence points toward a broader pattern now visible across several major Canadian markets. Projects already underway continue supporting active construction levels, but fewer projects appear positioned to replace them at the same pace over the next several years.
Québec’s first-quarter numbers therefore reflected resilience in the current construction pipeline rather than a fully expansionary market.
Atlantic Canada
Housing activity across Atlantic Canada remained comparatively small in national terms, though conditions varied across the region.
Nova Scotia: 1,504 → 1,307 (-13%)
Halifax: 1361 → 903 (-34%)
New Brunswick: 673 → 695 (+3%)
Fredericton: 145 → 110 (-24%)
Moncton: 436 → 443 (+2%)
Prince Edward Island: 289 → 362 (+25%)
Newfoundland and Labrador: 123 → 170 (+38%)
St. John’s: 122 → 117 (-4%)
Nova Scotia’s decline is notable because Halifax had previously experienced substantial housing pressure driven by migration and population growth.
At the same time, the Atlantic region’s smaller market size means percentage changes can appear dramatic even where underlying unit volumes remain comparatively limited.
Prince Edward Island and Newfoundland recorded sizeable percentage increases from relatively small bases. Those gains were not large enough to materially affect national totals, but they reinforce the increasingly fragmented nature of Canadian housing activity.
Rather than moving in a synchronized national cycle, regional markets are now responding differently depending on migration patterns, construction composition, financing conditions, and the maturity of their existing development pipelines.
A Market Adjusting Through Lag
The first quarter of 2026 did not produce evidence of a broad construction collapse.
National starts remained above year-earlier levels. Multi-family construction continued dominating both starts and completions. Large apartment projects remained active across most major urban markets.
But the quarter also reinforced the growing disconnect between visible construction activity and future development momentum.
The housing market is now adjusting through lag.
Projects already approved, financed, and underway continue supporting current starts and completion data. Meanwhile, the conditions required to launch the next generation of projects have become materially more difficult.
That distinction increasingly shapes how housing data should be interpreted.
Purpose-built rental projects continue carrying much of the construction pipeline because rental fundamentals remain comparatively stable and several governments continue supporting rental production through financing and tax programs.
Condominium-oriented development appears more vulnerable.
Developers across Toronto and Vancouver increasingly face pressure from weaker absorption, rising inventories, elevated construction costs, and financing structures that no longer support aggressive expansion assumptions.
Ontario and Québec helped sustain national growth during the quarter while Alberta and Saskatchewan moved lower after several years of unusually strong activity. British Columbia remained relatively stable overall but showed increasing divergence between Vancouver and the rest of the province.
Those differences matter because the national market is becoming more dependent on a smaller number of urban apartment markets and a narrower range of viable project types.
For now, construction activity remains supported by projects already moving through the system.
The more consequential question is whether enough financially viable projects are entering the pipeline to sustain today’s activity levels several years from now.
The first-quarter data suggests that answer is becoming less certain.